When an LLM app breaks in production, the error is rarely a stack trace. It is a model that quietly returned the wrong answer, a retrieval step that pulled stale context, or an agent that looped three times before giving up. Traditional logging cannot see any of it. Langfuse is the open-source platform built to make those invisible failures visible — and in 2026 it became one of the most consequential tools in the AI engineering stack.
If you are shipping anything more complex than a single prompt, this is the observability layer worth learning first.
Why Langfuse Suddenly Matters More
On January 16, 2026, ClickHouse acquired Langfuse alongside a $400M Series D that tripled its valuation to $15 billion. That was not a coincidence of timing. Langfuse was already built entirely on ClickHouse under the hood: every trace, every observation, every evaluation result it records lands in a ClickHouse table. The high-cardinality, append-heavy, time-series-shaped nature of LLM telemetry is exactly the workload ClickHouse was designed for.
The adoption numbers explain the interest. Langfuse counts roughly 30,000 GitHub stars as of mid-2026, more than 2,000 paying customers, and is used by 63 of the Fortune 500. It ships under an MIT license for the core platform, which means you can self-host the whole thing without a per-seat bill.
The pitch is simple: treat your LLM app like any other production system, with traces you can actually inspect — prompts, responses, tool calls, latency, and cost, all in one timeline.
What "Observability" Actually Means for LLMs
Standard APM tools answer "was the request fast, and did it 500?" That is the wrong question for AI. A model call can return HTTP 200 in 400ms and still be completely wrong.
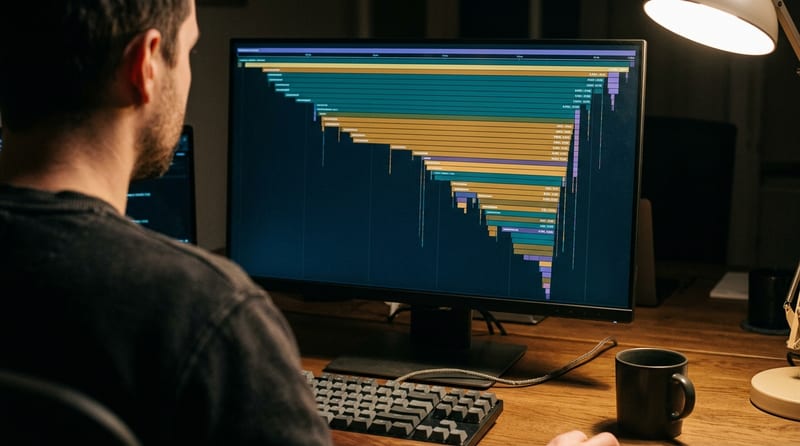
Langfuse organizes everything around traces and observations. A trace is one end-to-end request through your system. Inside it, observations are the individual steps — each LLM call, each retrieval, each tool invocation — nested hierarchically so you can see how a single user question fanned out into eight downstream calls.
That structure is what makes agent debugging tractable. When an agent misbehaves, you do not read log lines; you open the trace and watch the decision tree.
The Four Pillars
Langfuse is not just tracing. It bundles four capabilities that usually require four separate tools:
| Pillar | What it does |
|---|---|
| Tracing | Captures nested spans for every LLM call, tool, and retrieval step, with token counts, cost, and latency |
| Prompt management | Version prompts, roll them back, and edit them in a playground without redeploying code |
| Evaluations | Score outputs via LLM-as-judge, user feedback, or custom metrics |
| Datasets & experiments | Freeze real production traces into test sets and replay them against new models |
The last one is the quiet superpower. When GPT-5.6 or a new Claude model ships, you can replay yesterday's real traffic against it and measure quality before switching a single user over.
Getting Started: The Python SDK
Langfuse's Python SDK v3 went generally available in mid-2025 and is now built directly on OpenTelemetry (OTEL). That matters: any library already instrumented with OTEL will have its spans captured and correctly nested inside your Langfuse traces automatically.
Install the latest release:
pip install --upgrade langfuse
The fastest way to instrument a function is the @observe decorator. It starts and ends a trace around the function and captures its name, arguments, and return value with zero manual span management:
from langfuse import observe, get_client

@observe
def answer_question(query: str) -> str:
    # your LLM logic here
    return llm_call(query)
Under the hood, resources are initialized once via get_client(), which you can grab globally when you need finer control:
langfuse = get_client()
Set three environment variables — your public key, secret key, and host — and traces start flowing immediately. That is the entire setup.
Nesting Real Work Inside a Trace
The decorator becomes powerful once you stack it. Decorate the outer request handler and the inner steps, and Langfuse builds the hierarchy for you:
from langfuse import observe

@observe
def retrieve(query: str):
    return vector_db.search(query)

@observe
def generate(context: str, query: str):
    return model.complete(context, query)

@observe
def rag_pipeline(query: str):
    docs = retrieve(query)
    return generate(docs, query)
Open the trace for rag_pipeline and you see the retrieval and generation as child spans, each with its own latency and, for the model call, token and cost breakdowns. When answers go wrong, you can immediately tell whether retrieval fed garbage or the model hallucinated on good context.
Framework Integrations You Get for Free
Because the SDK sits on OpenTelemetry, Langfuse integrates cleanly with the tools most teams already run. It has first-class support for LangChain and LangGraph via callbacks, the OpenAI SDK, Anthropic, and LiteLLM as a drop-in proxy. If you route all model traffic through LiteLLM, you can get full-stack tracing across every provider without touching your application code — the proxy reports to Langfuse for you.
This is the practical reason to standardize early: instrument once at the framework or proxy layer, and every future model swap inherits observability automatically.
A Sensible Rollout Order
For a team adding Langfuse to an existing app, resist the urge to boil the ocean. A workable sequence:
First, self-host or spin up cloud and get raw tracing on your hottest endpoint. Seeing real token costs per request usually pays for the effort within a day.
Second, move your prompts into Langfuse prompt management so you can iterate without deploys.
Third, capture a dataset from real traces and wire up one LLM-as-judge evaluation on the metric you care about most — factuality, tone, or format compliance.
Only after those three are humming should you invest in elaborate custom dashboards. The goal is a tight feedback loop, not a wall of graphs.
Where It Falls Short
Langfuse is not magic. LLM-as-judge evaluations are only as trustworthy as the judge prompt, and a badly calibrated judge will confidently mislead you. Self-hosting the full stack means running ClickHouse, which is a real operational commitment if your team has never operated it. And high-volume tracing generates a lot of data — you will want sampling and retention policies before you scale, not after.
None of these are dealbreakers. They are the ordinary cost of treating AI as production software instead of a demo.
The Bottom Line
LLM apps fail silently, and you cannot fix what you cannot see. Langfuse turns opaque model behavior into inspectable traces, versioned prompts, and repeatable evaluations — the same discipline every other part of your stack already has. The ClickHouse acquisition removed the last real worry about longevity, the MIT-licensed core keeps self-hosting free, and the OpenTelemetry foundation means it plugs into what you already run. If you are past the prototype stage, install it this week. The first trace you open will show you something about your app you did not know.